
Riemann Sum
Geometry Under Curves
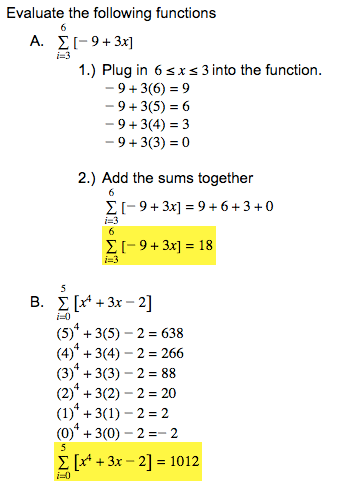
The Riemann Sum is a notation that calculates the area approximination under a curve.
The above notation is the Riemann Sum formula. The sigma represents the boundaries and the x-values that are included in the calculation of the area bounded by i (the lower boundary) and n (the upper boundary). Delta x represents the amount of rectangles or trapezoids that will used to estiminate the area.
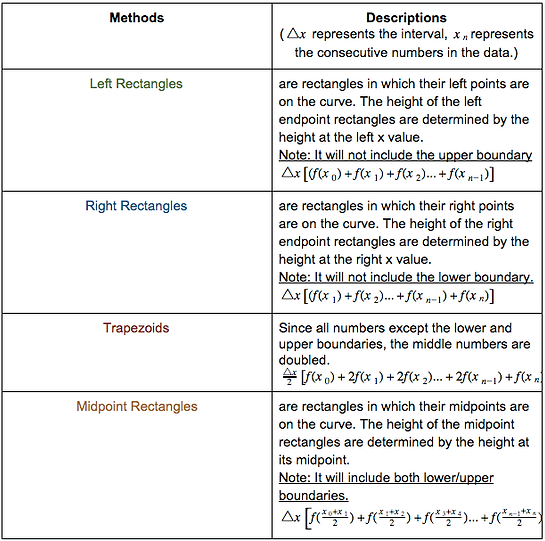
The Riemann Sum could also be represented as the 4 methods below. Each method requires the use of rectangles and trapezoids to find the area under the curve.
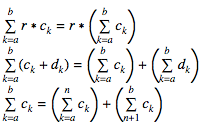
Rules with Sigma Notation (where r is a constant)
Finding Area Approximations
Find the area under the curve, bounded between x=0 and x=3 with 6 subdivisions. Use all 4 approximation methods.
Find delta x using the following formula.
Delta x is the width of a rectangle or a trapezoid.
Where b represents the upper boundary, a represents the lower boundary, and n represents the number of subdivisions.
This means that if we were to create 6 subdivisions, in order words 6 rectangles or trapezoids, the width of each rectangle or trapezoid needs to be 0.5units.
Left Rectangles
1.) Create a x and y table.
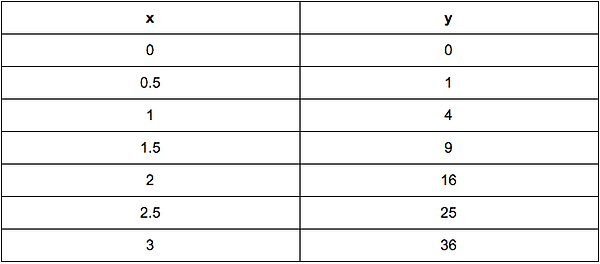
2.) Use the left rectangle formula.
Based on the way that the left rectangles are laid out, the left most point of the last rectangle will not be on 3 (upper boundary). Thus, f(3) will not be within the calculation.

The area of between x=0 and x=3 will be 27.5 units squared.
This area will be an underestimation because there are still areas under the curve that are not counted (the white triangles between the curve and the rectangles).
-
When the function is increasing, left hand approximations will always be an underestimation.
-
When the function is decreasing, the left hand approximations will always be an overestimation.
Right Hand Rectangles
1.) Create a x and y chart. (Use the table above)
2.) Use the right rectangle formula.
Based on the way that the right rectangles are laid out, the right most point of the first rectangle will not be on 0 (lower boundary). Thus, f(0) will not be within the calculation.
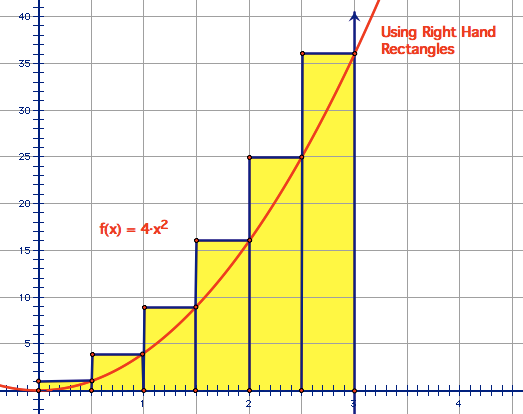
The area of between x=0 and x=3 will be 45.5 units squared.
This area will be an overestimation because some of the area above the curve are also calculated (the yellow triangles above the curve).
-
When the function is increasing, right hand approximations will always be an overestimation.
-
When the function is decreasing, the right hand approximations will always be an underestimation.
Trapezoids
1.) Create x and y table (Use chart above).
2.) Use the trapezoid formula.
Since the area of the trapezoids is , the delta x will be divided by 2 and all of the heights, exluding the upper and lower boundaries, will double count.
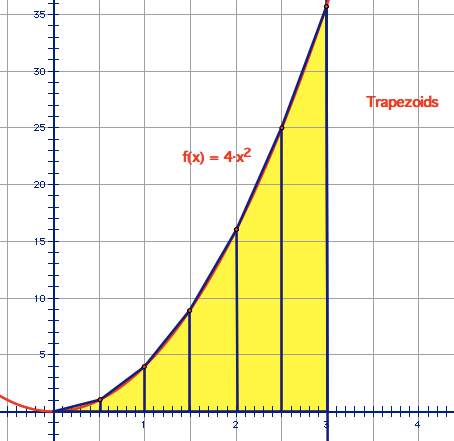
The area of between x=0 and x=3 will be 36.5 units squared.
Midpoint Rectangles
1.) Create a x and y chart.
Use the mid values between the intervals between x=0 and x=3.
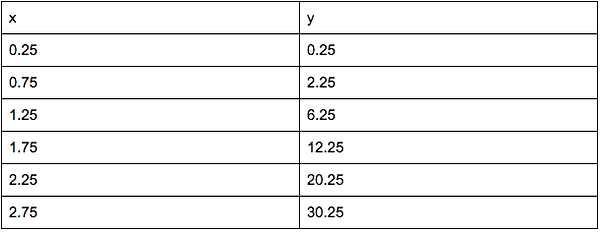
2.) Use the Midpoint Formula.
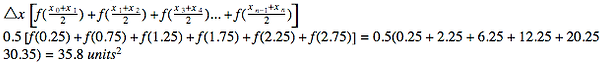
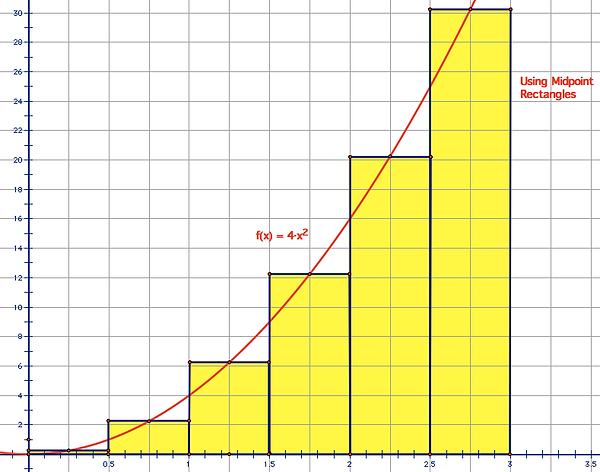
The area of between x=0 and x=3 will be 36.5 units squared.
This area will be a value that is between the area of the left and right rectangles, making it the most accurate of the three methods in most cases.
The Limit of Riemann Sum
If you take the limit of the Riemann Sum of f(x) as n approaches positive infinity, then it will equal to the definite integral of f(x). In other words, the definite integral of f(x) is equal to the limit of the left or right hand sum with n subdivisions of [a,b] as n gets larger. The a and b are the limits of integration.
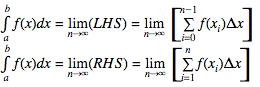
Left and Right Hand Sums in Riemann Sum Notation
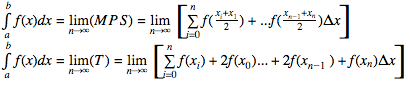
Trapezoidal and Midpoint Sums in Riemann Sum Notation
Generalizations
1.) When f(x) is positive and a is less than b, the area under the graph of f bounded by a and b will equal to .
2.) When f(x) is positive for some x values and negative for others, and a is less than b, then is the sum of the areas above the x-axis, counted positively, and the areas below the x-axis, counted negatively.