
Introducing Limits
A limit is a value that a function is approaching to, but never reaches. If the function, f(x), is approaching L as x is approaching to c, from the either left or right, the limit of the function f(x) as x is approaching c is equal to L.
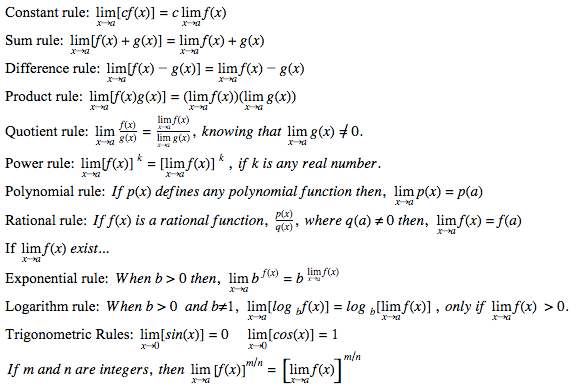
Limits General Formula
Asymptotes
Asymptotes are lines or curves that are approaching to c, but never reaches c. Asymptotes are present when the function is discontinuous. The location of an asymptote indicates a value or values that are undefined in a function. There are three types of asymptotes; horizontal asymptotes, vertical asymptotes, and slant asymptotes.
Determining Asymptotes
If n<m,then the x-axis is the horizontal asymptote.
If n=m,then the horizontal asymptote is the line y=ab.
If n>m,then there is no horizontal asymptote. There is a slant asymptote.
The limit does not exist when:
A function increases or decreases without bound.
The left and right-hand limits are not equal.
The function oscillated between two values.
Ex: f(x)=sin(x)
Calculating Limits
There are four methods to calculate a limit; substituting, graphically, algebraically and inspecting.
Substitution: Subtitution could only be used if the output of the function is defined after c is plugged into x.
Graphing: Limits could be determined by finding the c value that the function is approaching on a give graph.

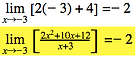
Based on the rule, ,where L is the y-value that the function is approaching when x is approaching c. Based on this, we can come to a conclusion that when x→2 the L value will be 6.
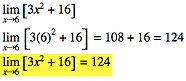
Inspection: Inspection is a conbination of subtitution and using your mathematical knowledge to use by plugging in x into the function and then predict the limit.

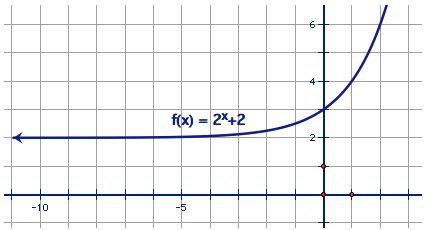
While observing the limit, we will realize that as we are approaching towards positive infinity the x-value will increase little by little and so does the output of the function. The function will increase without bound as it moves towards positive infinity. Therefore, the limit does not exist.
Aside from aymptotic discontinuities, there are also point and jump discontunities.
Point: It occurs when a function is undefined at a specific point or a set of points.
Jump: It occurs when the function approches looks disconnected because the curve or line is not continuously drawn.
Types of Discontinuities
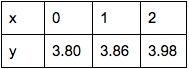
This table shows a limit because you could see that it goes closer and closer to 4, but never reaches 4.
Example of a Limit
Algebraic: This method should be used when direct substitution fails. For example, if you plug in x into the function, the function will be undefined. This method helps to prevent the denominator from equaling to 0.

Plug in x back into the manipulated limit function to get a real number.
Continuity
A continuous function should have a domain and a range that includes all x and y-values, in other words, all real numbers. When graphing a continuous function, you should never have to pick up your writing ustensil. If you so, then there will have to be asymptotes, holes, or other forms of discontinuity.
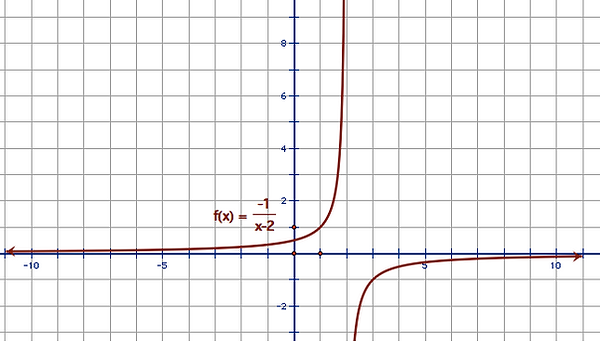
Based on this graph, the domain is
and the range is .
There is a horizontal asymptote at x=0 and a vertical asymptote at x=2. Thus, this function is not continuous.

Based on the intervals given, there is a hole at x=3 because both of the functions does not include 3 as its x-value. Thus, this function is not continuous.
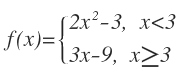
Based on the intervals given, this is a jump discontinuity because if you plug in 3 for both of the functions, its output will not be the same (therefore the two functions could not match up at x=3). For example,
2(3)^2-3=15 and 3(3)-9=0.